4 Demonstration example
The previous remarks will now be illustrated using a small demonstration example. It should be noted, however, that the values given were determined arbitrarily in terms of their selection and size. A concordance with the actual conditions was not aspired, because it is not possible with such a small number of selected professions. It's about the principle.
There are 100 employable members of society (workers), i.e. a=100.
There are 4 different professions, i.e. m3=4
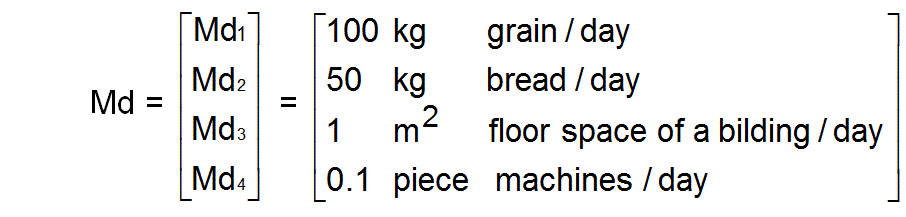
The work performances of the professions can be measured in the corresponding units of measurement:
| j3 | Profession | Unit of measurement / normal work performance |
|---|---|---|
| 1 | Farmer | 100 kg of grain per day |
| 2 | Baker | 50 kg of bread per day |
| 3 | Brick mason | 1 m2 floor space of a building per day |
| 4 | Mechanics | 0.1 piece of a machine per day |
Thus the vector of the units of measurement or of the normals of work performances is given by
With these normals, all parameters that represent work performances are made dimensionless. Abbreviations with a capital initial letter stand for parameters with dimensions and abbreviations with a small initial letter stand for the corresponding dimensionless parameters.
There are 10 different productivity groups, i.e. m2=10. Each productivity group consists of 10 workers, i.e. apj2 = 10 for all j2= 1 to m2. The individual productivity profiles of all workers in society are described by the dimensionless productivity matrix p.
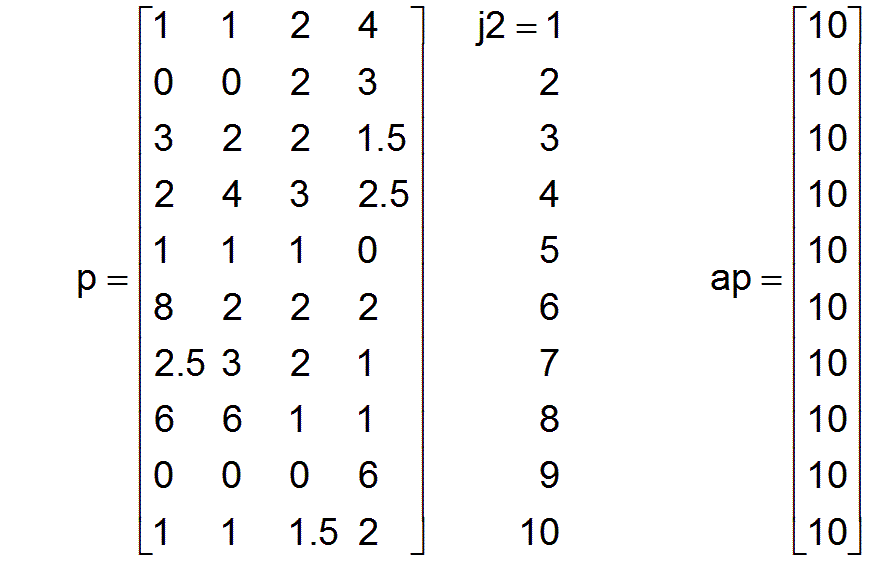
For example the first row of the productivity matrix p signifies that a worker in the first productivity group is able to produce 1 × 100 kg of grain per day as a farmer (j3=1), or as a baker (j3=2) to bake 1 × 50 kg of bread per day, or as a brick mason (j3=3) to build a part of a building with an average of 2 × 1 m2 of usable floor space, or as a mechanic (j3=4) to build 4 × 0.1 machines.
The vector db0 of a needs-based performance structure is given by
db0 = [ 2 2 3 4 ]
This means that the work performance of 2 × 100 kg of grain per day, 2 × 50 kg of bread per day, 3 × 1 m2 of floor space of a building per day, and 4 × 0.1 machines per day represent a needs-based performance structure.
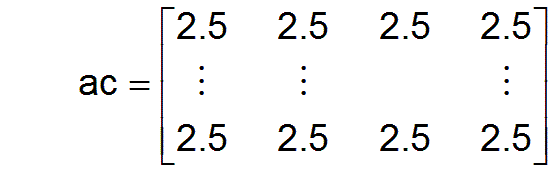
Now an employment matrix which is not supposed to be optimal yet, but is determined arbitrarily shall be given. As an easy example, every productivity group should be included in equal proportions in every profession in the beginning. And the number of employees in every profession should also be the same. Thus in the beginning the employment matrix ac is given by
Hence all primary parameters are given.
The next task would be to determine an optimal employment matrix. But this is only possible after knowing the next paragraphs. First, however, some secondary parameters can be calculated for this demonstration example, which are later applicable for evaluating our employment matrix.
The normalized productivities pnj3 are calculated according to equation (4) and result in the following values:
pn = [ 2.45 2.00 1.65 2.30]
The current mean productivities pmj3 are calculated according to equation (7) and result in the following values with the currently defined employment matrix:
pm = [ 2.45 2.00 1.65 2.30]
pn and pm are currently the same, because initially all productivity groups are represented equally in all professions. As a result, the factors fpj3 of the increases of productivity in the individual professions are all equal to one.
For fpj3= pmj3 / pnj3 applies fp1=1 fp2=1 fp3=1 fp4=1
That means with the given employment matrix there is still no increase in productivity compared to the normalized productivities pn
The normalized needs-based performance structure is calculated using equation (9) and results in the following values:
dbn = [ 0.3722 0.3722 0.5583 0.7444 ]
The components of the vector d of the overall societal work performance are calculated according to equation (5) and result in the values:
d = [ 61.25 50.00 41.25 57.50 ]
The vector d contains the maximum needs-based vector db:
db = [ 27.50 27.50 41.25 55.00 ]
The comparison of the vector d with the vector db shows that only the performances in profession j3=3 match. That means that currently only the workers in profession j3=4 work for a needs-based performance structure, while in the other three professions there is a relative oversupply of labor. By fluctuation of some workers from the first three professions to the fourth profession, for example, the vector db could be increased and the relative oversupply of workers in the first three professions could be reduced.
The factors fbj3 for assessing the needs-conformity of the work performance in the individual professions are calculated according to equation (11)


They show that society as a whole is still a long way from being able to work according to the needs.
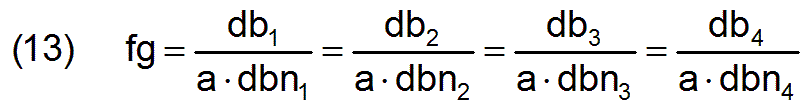
The factor fbg which is a measure of the needs-conformity of the work performance for society as a whole, is calculated by equation (12) and results in the value
fbg =0,739
The factor fg of the increase in performance for the entire society is calculated by one of the m3 equations (10).

This complex factor results from the respective increases in productivity in the various professions and from the needs-conformity of the respective professions, which in turn all depend on the employment matrix ac. It applies fg=fbg, since the mean productivities pmj3 in our example are all equal to the normalized productivities pnj3 and thus all fpj3=1. This example already shows that an inappropriate choice of the employment matrix ac can also lead to a deterioration in performance for society as a whole. In our case, the deterioration in performance was caused solely by work performance in the individual professions that was not needs-conform.
Return Go on